When the Market Goes Sideways
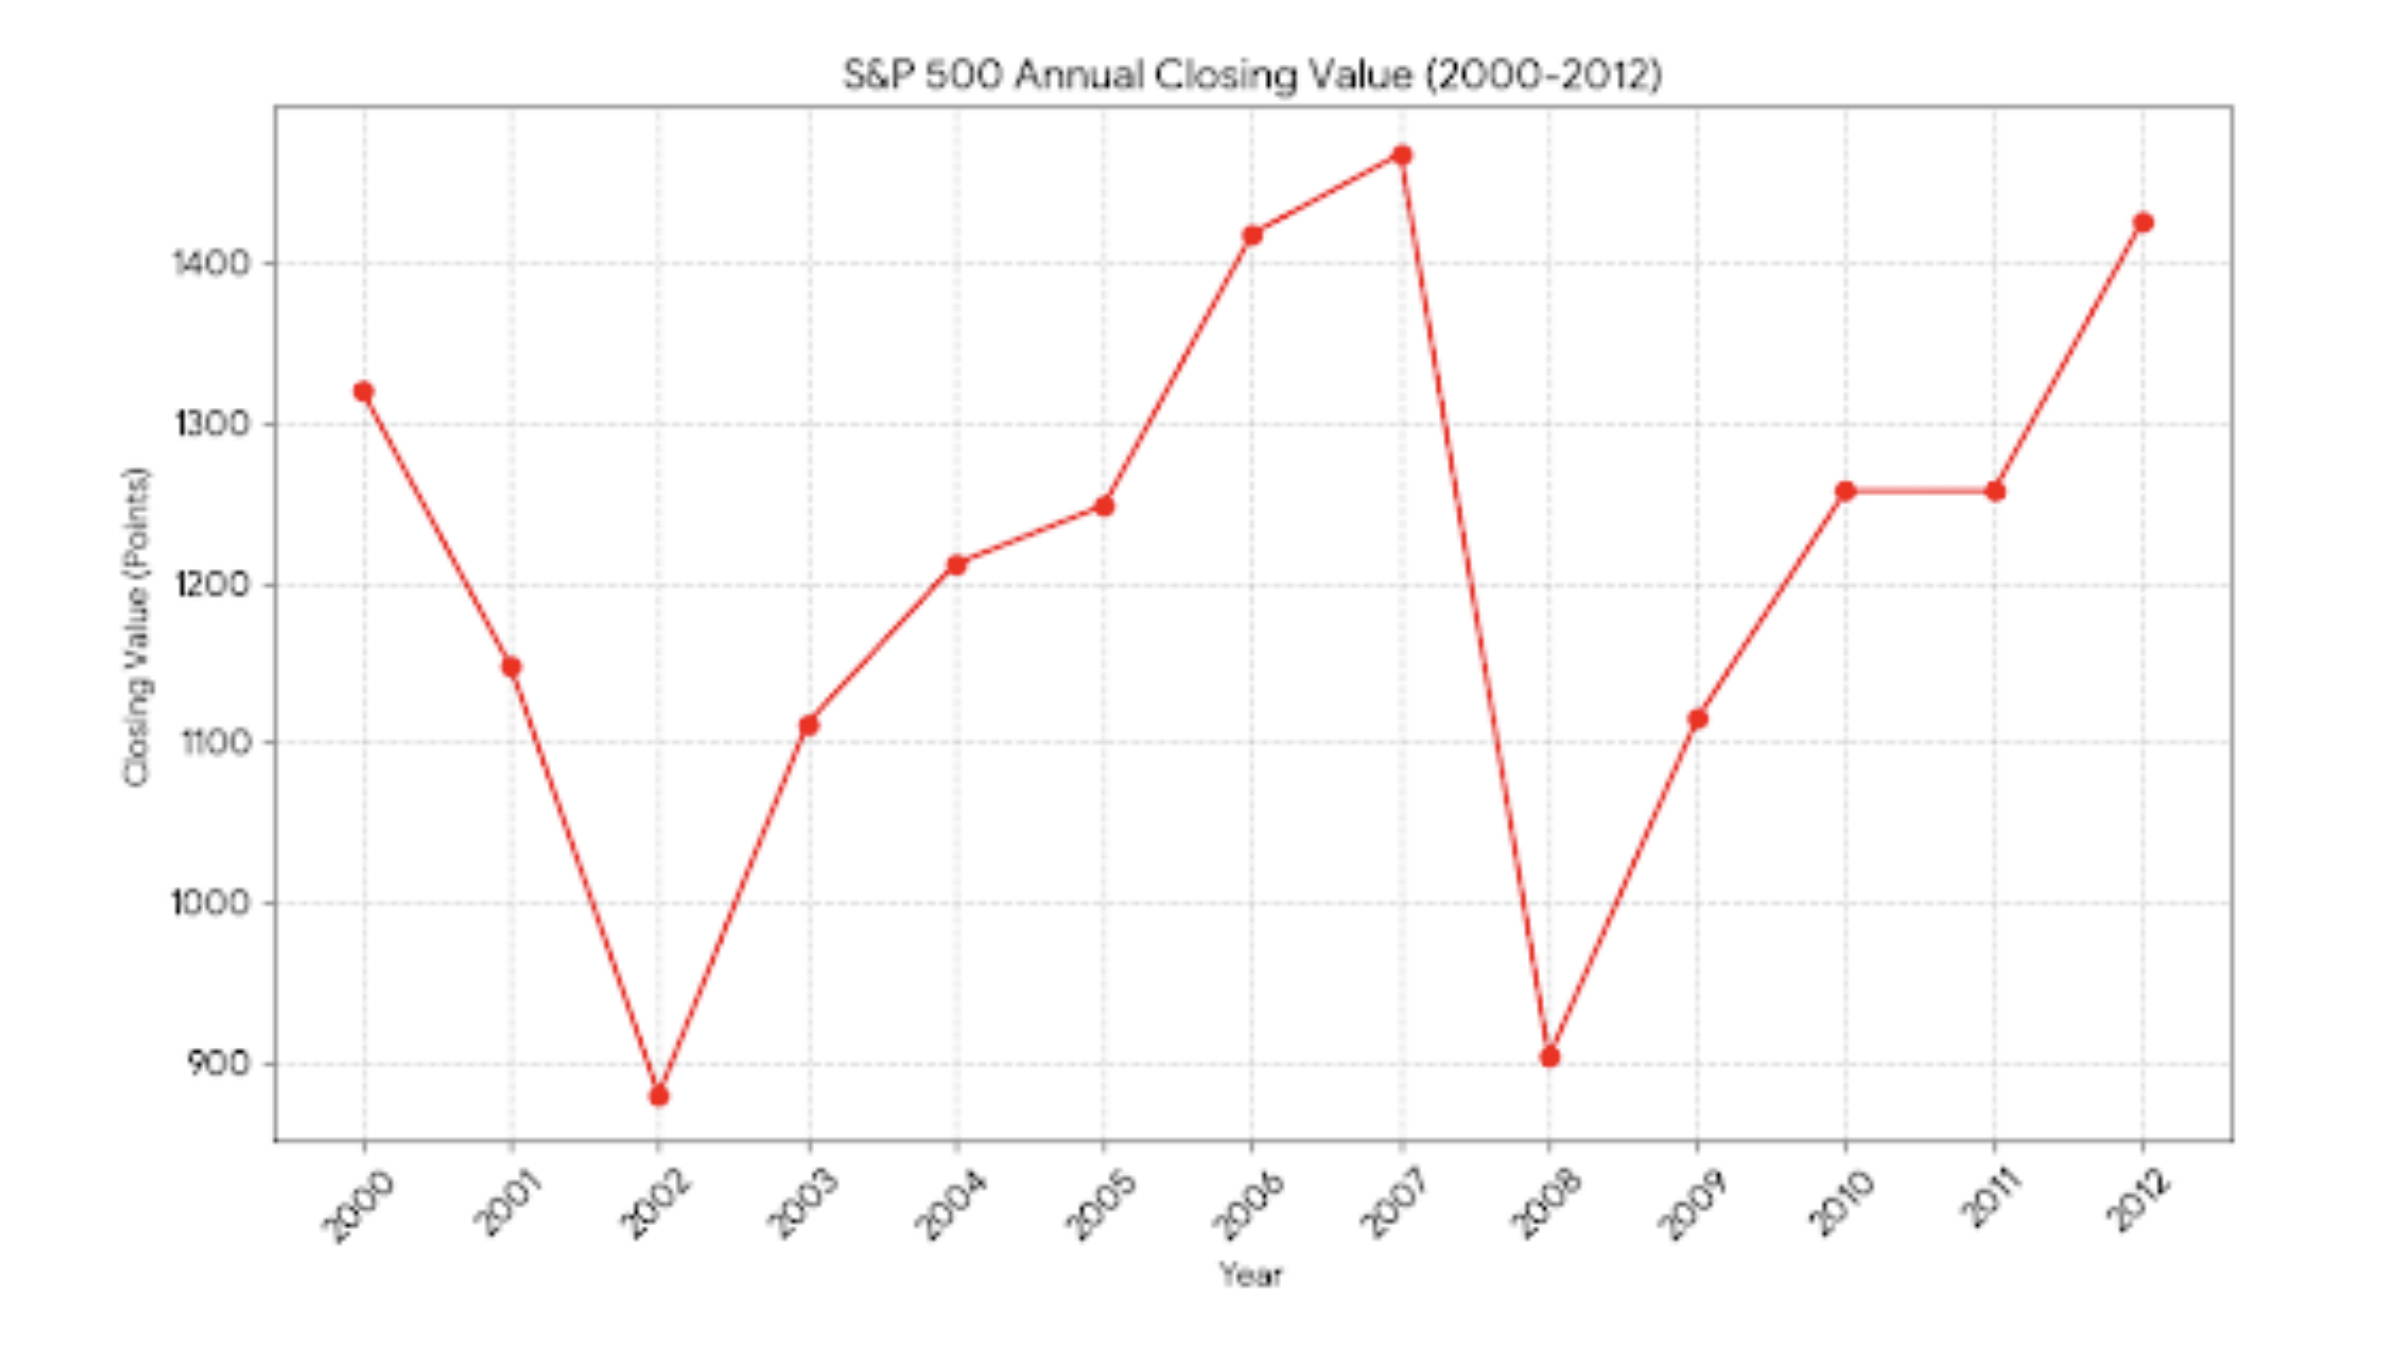
Between 2000 and 2012, the S&P 500 price index barely moved.
Twelve years. Two major bear markets and the recoveries that followed.
(The graphic shows index levels only. Dividends are excluded.)
History at a Glance 2000 to 2012
The tech bubble burst in 2000 to 2002 and stocks fell sharply.
The global financial crisis in 2007 to 2009 delivered another deep drawdown.
From year end 2000 to year end 2012, the index rose from 1,320.28 to 1,426.19, about 8 percent in total before dividends.
What a Plan Can Do
Income planning: Create a spending and income plan that is designed to keep you invested through down years. The order of returns matters for retirees (sequence of returns risk).
Diversification: Blend sources of risk and return. Institutions use alternative strategies such as private equity, marketable alternatives, and venture capital in meaningful allocations.
Let Us Review Your Plan
We can walk through how income strategies may reduce the impact of downturns, how alternatives can diversify risk when suitable, and how a coordinated mix can keep your portfolio resilient for the long run.
Educational material only. Past performance is not a guarantee of future results. All investing involves risk including the loss of principal. Diversification and asset allocation may not assure a profit and do not protect against loss. Index results are for illustration and do not represent the performance of any client account.
Notes and Sources
S&P 500 Historical Data (Yahoo Finance): https://finance.yahoo.com/quote/%5EGSPC/history/
Dot-Com Bear Market Data (Macrotrends): https://www.macrotrends.net/2324/sp-500-historical-chart-data
S&P 500 overview
https://www.spglobal.com/spdji/en/indices/equity/sp-500/Sequence of Returns Risk (Jackson National Research Summary): https://www.jackson.com/content/dam/campaign/th6mo09fohar4wrifr1s/cmx2072.pdf
Price vs Total Return (S&P Dow Jones Methodology): https://www.spglobal.com/spdji/en/documents/methodologies/methodology-index-math.pdf

